Generic filtering
![]()
filter
Generic filtering of events can be done using the filter
function, which takes an event log and any number of logical conditions.
The example below filters events which have vehicleclas “C” and amount
greater than 300. More process-specific filtering methods can be found
here.
## # Log of 20 events consisting of:
## 1 trace
## 20 cases
## 20 instances of 1 activity
## 10 resources
## Events occurred from 2006-08-10 until 2008-02-09
##
## # Variables were mapped as follows:
## Case identifier:     case_id
## Activity identifier:     activity
## Resource identifier:     resource
## Activity instance identifier:    activity_instance_id
## Timestamp:           timestamp
## Lifecycle transition:        lifecycle
##
## # A tibble: 20 × 18
##    case_id activity    lifecycle resource timestamp           amount article
##    <chr>   <fct>       <fct>     <fct>    <dttm>              <chr>    <dbl>
##  1 A10060  Create Fine complete  541      2007-03-08 00:00:00 36.0       157
##  2 A10497  Create Fine complete  558      2007-03-30 00:00:00 36.0       157
##  3 A10818  Create Fine complete  561      2007-04-08 00:00:00 36.0       157
##  4 A11707  Create Fine complete  550      2007-04-24 00:00:00 36.0       157
##  5 A11936  Create Fine complete  557      2007-04-29 00:00:00 36.0       157
##  6 A12073  Create Fine complete  557      2007-05-03 00:00:00 36.0       157
##  7 A1408   Create Fine complete  559      2006-08-20 00:00:00 35.0       157
##  8 A14883  Create Fine complete  561      2007-06-29 00:00:00 36.0       157
##  9 A17130  Create Fine complete  541      2007-07-15 00:00:00 36.0       157
## 10 A1815   Create Fine complete  563      2006-08-10 00:00:00 35.0       157
## 11 A19109  Create Fine complete  556      2007-07-17 00:00:00 36.0       157
## 12 A23000  Create Fine complete  550      2007-12-29 00:00:00 36.0       157
## 13 A24247  Create Fine complete  561      2007-12-03 00:00:00 36.0       157
## 14 A24366  Create Fine complete  541      2008-02-09 00:00:00 36.0       157
## 15 A24634  Create Fine complete  537      2007-11-21 00:00:00 36.0       157
## 16 A24942  Create Fine complete  561      2007-12-30 00:00:00 36.0       157
## 17 A25581  Create Fine complete  559      2007-11-23 00:00:00 36.0       157
## 18 A25599  Create Fine complete  559      2007-11-24 00:00:00 36.0       157
## 19 A26099  Create Fine complete  559      2007-12-09 00:00:00 36.0       157
## 20 A26277  Create Fine complete  538      2008-01-07 00:00:00 36.0       157
## # ℹ 11 more variables: dismissal <chr>, expense <chr>, lastsent <chr>,
## #   matricola <dbl>, notificationtype <chr>, paymentamount <dbl>, points <dbl>,
## #   totalpaymentamount <chr>, vehicleclass <chr>, activity_instance_id <chr>,
## #   .order <int>
slice
An eventlog can be sliced, which mean returning a slice, i.e. a subset, from the eventlog, based on row number. There are three ways to slice event logs
- Using
slice: take a slice of cases - Using
slice_activities: take a slice of activity instances - Using
slice_events: take a slice of events
The next piece of code returns the first 10 cases. Note that first here is defined by the current order of the data set, not by time.
## # Log of 110 events consisting of:
## 2 traces
## 10 cases
## 55 instances of 7 activities
## 7 resources
## Events occurred from 2017-01-02 11:41:53 until 2017-01-11 11:39:30
##
## # Variables were mapped as follows:
## Case identifier:     patient
## Activity identifier:     handling
## Resource identifier:     employee
## Activity instance identifier:    handling_id
## Timestamp:           time
## Lifecycle transition:        registration_type
##
## # A tibble: 110 × 7
##    handling   patient employee handling_id registration_type time
##    <fct>      <chr>   <fct>    <chr>       <fct>             <dttm>
##  1 Registrat… 1       r1       1           start             2017-01-02 11:41:53
##  2 Registrat… 2       r1       2           start             2017-01-02 11:41:53
##  3 Registrat… 3       r1       3           start             2017-01-04 01:34:05
##  4 Registrat… 4       r1       4           start             2017-01-04 01:34:04
##  5 Registrat… 5       r1       5           start             2017-01-04 16:07:47
##  6 Registrat… 6       r1       6           start             2017-01-04 16:07:47
##  7 Registrat… 7       r1       7           start             2017-01-05 04:56:11
##  8 Registrat… 8       r1       8           start             2017-01-05 04:56:11
##  9 Registrat… 9       r1       9           start             2017-01-06 05:58:54
## 10 Registrat… 10      r1       10          start             2017-01-06 05:58:54
## # ℹ 100 more rows
## # ℹ 1 more variable: .order <int>
slice_activities
The next piece of code returns the first 10 activity instances.
## # Log of 20 events consisting of:
## 1 trace
## 10 cases
## 10 instances of 1 activity
## 1 resource
## Events occurred from 2017-01-02 11:41:53 until 2017-01-06 09:13:28
##
## # Variables were mapped as follows:
## Case identifier:     patient
## Activity identifier:     handling
## Resource identifier:     employee
## Activity instance identifier:    handling_id
## Timestamp:           time
## Lifecycle transition:        registration_type
##
## # A tibble: 20 × 7
##    handling   patient employee handling_id registration_type time
##    <fct>      <chr>   <fct>    <chr>       <fct>             <dttm>
##  1 Registrat… 1       r1       1           start             2017-01-02 11:41:53
##  2 Registrat… 2       r1       2           start             2017-01-02 11:41:53
##  3 Registrat… 3       r1       3           start             2017-01-04 01:34:05
##  4 Registrat… 4       r1       4           start             2017-01-04 01:34:04
##  5 Registrat… 5       r1       5           start             2017-01-04 16:07:47
##  6 Registrat… 6       r1       6           start             2017-01-04 16:07:47
##  7 Registrat… 7       r1       7           start             2017-01-05 04:56:11
##  8 Registrat… 8       r1       8           start             2017-01-05 04:56:11
##  9 Registrat… 9       r1       9           start             2017-01-06 05:58:54
## 10 Registrat… 10      r1       10          start             2017-01-06 05:58:54
## 11 Registrat… 1       r1       1           complete          2017-01-02 12:40:20
## 12 Registrat… 2       r1       2           complete          2017-01-02 15:16:38
## 13 Registrat… 3       r1       3           complete          2017-01-04 06:36:54
## 14 Registrat… 4       r1       4           complete          2017-01-04 04:25:06
## 15 Registrat… 5       r1       5           complete          2017-01-04 20:07:50
## 16 Registrat… 6       r1       6           complete          2017-01-04 18:12:46
## 17 Registrat… 7       r1       7           complete          2017-01-05 06:27:49
## 18 Registrat… 8       r1       8           complete          2017-01-05 07:58:17
## 19 Registrat… 9       r1       9           complete          2017-01-06 07:18:32
## 20 Registrat… 10      r1       10          complete          2017-01-06 09:13:28
## # ℹ 1 more variable: .order <int>
slice_events
The next piece of code returns the first 10 events.
## # Log of 10 events consisting of:
## 1 trace
## 10 cases
## 10 instances of 1 activity
## 1 resource
## Events occurred from 2017-01-02 11:41:53 until 2017-01-06 05:58:54
##
## # Variables were mapped as follows:
## Case identifier:     patient
## Activity identifier:     handling
## Resource identifier:     employee
## Activity instance identifier:    handling_id
## Timestamp:           time
## Lifecycle transition:        registration_type
##
## # A tibble: 10 × 7
##    handling   patient employee handling_id registration_type time
##    <fct>      <chr>   <fct>    <chr>       <fct>             <dttm>
##  1 Registrat… 1       r1       1           start             2017-01-02 11:41:53
##  2 Registrat… 2       r1       2           start             2017-01-02 11:41:53
##  3 Registrat… 3       r1       3           start             2017-01-04 01:34:05
##  4 Registrat… 4       r1       4           start             2017-01-04 01:34:04
##  5 Registrat… 5       r1       5           start             2017-01-04 16:07:47
##  6 Registrat… 6       r1       6           start             2017-01-04 16:07:47
##  7 Registrat… 7       r1       7           start             2017-01-05 04:56:11
##  8 Registrat… 8       r1       8           start             2017-01-05 04:56:11
##  9 Registrat… 9       r1       9           start             2017-01-06 05:58:54
## 10 Registrat… 10      r1       10          start             2017-01-06 05:58:54
## # ℹ 1 more variable: .order <int>
first_n, last_n
The slice function select events, cases or activity instances based
on their current position in the event data. As such, the result can be
changed using the arrange function. More often, we want to
select the first n activity instances, or the last ones. This
is achieved with the first_n or last_n
functions, which return the first, resp. last, n activity instances of a
log based on time, not on position.
## # Log of 10 events consisting of:
## 2 traces
## 3 cases
## 5 instances of 2 activities
## 2 resources
## Events occurred from 2017-01-02 11:41:53 until 2017-01-04 04:25:06
##
## # Variables were mapped as follows:
## Case identifier:     patient
## Activity identifier:     handling
## Resource identifier:     employee
## Activity instance identifier:    handling_id
## Timestamp:           time
## Lifecycle transition:        registration_type
##
## # A tibble: 10 × 7
##    handling   patient employee handling_id registration_type time
##    <fct>      <chr>   <fct>    <chr>       <fct>             <dttm>
##  1 Registrat… 1       r1       1           start             2017-01-02 11:41:53
##  2 Registrat… 2       r1       2           start             2017-01-02 11:41:53
##  3 Triage an… 1       r2       501         start             2017-01-02 12:40:20
##  4 Registrat… 1       r1       1           complete          2017-01-02 12:40:20
##  5 Registrat… 2       r1       2           complete          2017-01-02 15:16:38
##  6 Triage an… 2       r2       502         start             2017-01-02 22:32:25
##  7 Triage an… 1       r2       501         complete          2017-01-02 22:32:25
##  8 Triage an… 2       r2       502         complete          2017-01-03 12:34:01
##  9 Registrat… 4       r1       4           start             2017-01-04 01:34:04
## 10 Registrat… 4       r1       4           complete          2017-01-04 04:25:06
## # ℹ 1 more variable: .order <int>
This is not impacted by a different ordering of the data since it will take the time aspect into account.
## # Log of 10 events consisting of:
## 2 traces
## 3 cases
## 5 instances of 2 activities
## 2 resources
## Events occurred from 2017-01-02 11:41:53 until 2017-01-04 04:25:06
##
## # Variables were mapped as follows:
## Case identifier: patient
## Activity identifier: handling
## Resource identifier: employee
## Activity instance identifier: handling_id
## Timestamp: time
## Lifecycle transition: registration_type
##
## # A tibble: 10 × 7
## handling patient employee handling_id registration_type time
## <fct> <chr> <fct> <chr> <fct> <dttm>
## 1 Registrat… 1 r1 1 start 2017-01-02 11:41:53
## 2 Registrat… 2 r1 2 start 2017-01-02 11:41:53
## 3 Triage an… 1 r2 501 start 2017-01-02 12:40:20
## 4 Registrat… 1 r1 1 complete 2017-01-02 12:40:20
## 5 Registrat… 2 r1 2 complete 2017-01-02 15:16:38
## 6 Triage an… 2 r2 502 start 2017-01-02 22:32:25
## 7 Triage an… 1 r2 501 complete 2017-01-02 22:32:25
## 8 Triage an… 2 r2 502 complete 2017-01-03 12:34:01
## 9 Registrat… 4 r1 4 start 2017-01-04 01:34:04
## 10 Registrat… 4 r1 4 complete 2017-01-04 04:25:06
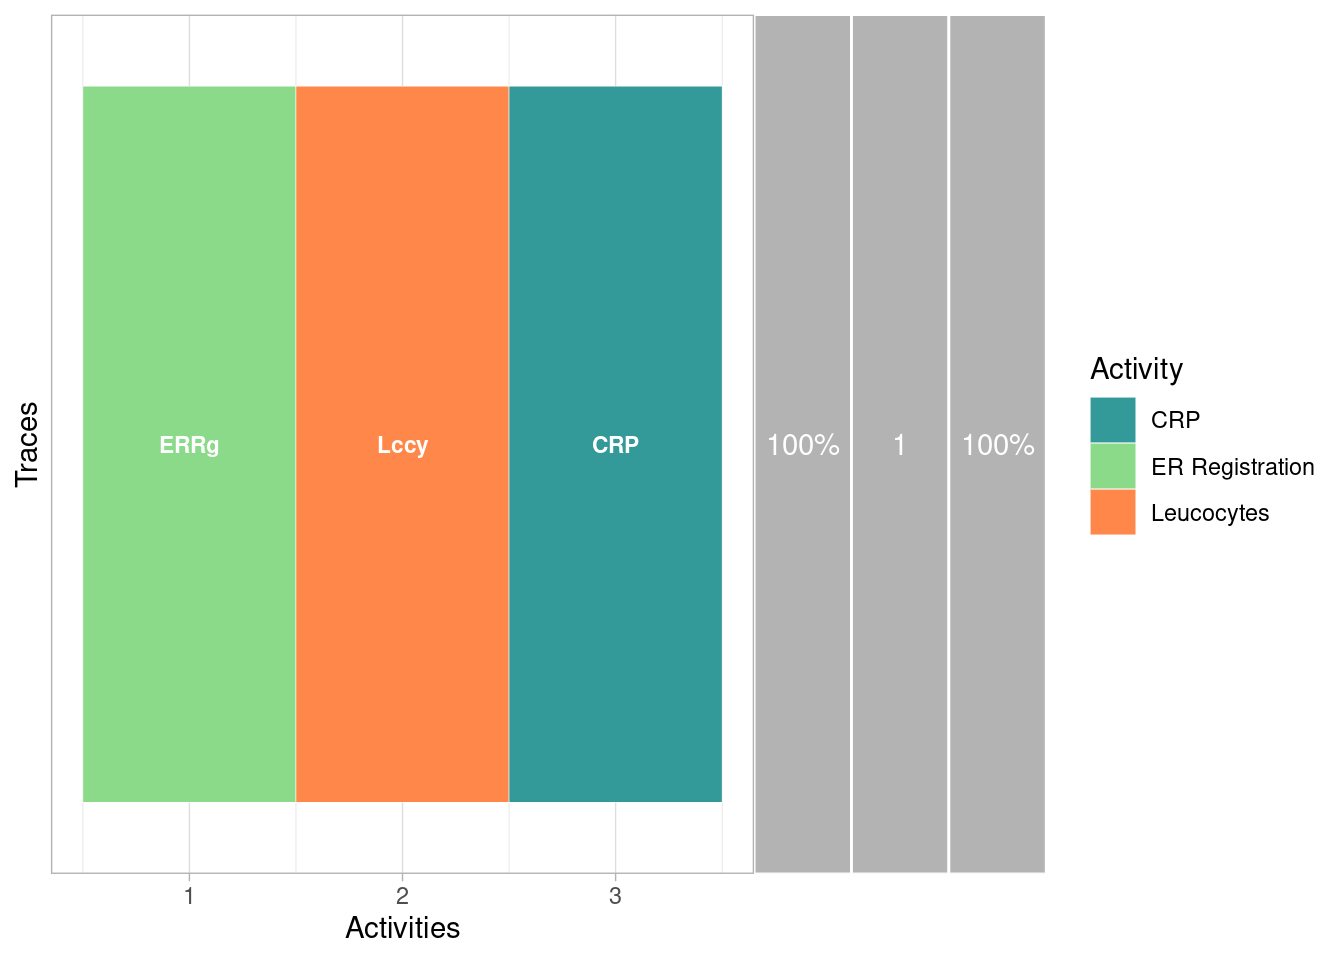
## # ℹ 1 more variable: .order <int>Incombination with group_by_case, it is very easy to
select the heads or tails of each case. Below, we explore the 95% most
common first 3 activities in the sepsis log.
sample_n
The sample_n function allows to take a sample of the
event log containing n cases. The code below returns a sample of 10
patients.
## # Log of 114 events consisting of:
## 2 traces
## 10 cases
## 57 instances of 7 activities
## 7 resources
## Events occurred from 2017-03-30 13:32:50 until 2018-02-21 14:56:59
##
## # Variables were mapped as follows:
## Case identifier:     patient
## Activity identifier:     handling
## Resource identifier:     employee
## Activity instance identifier:    handling_id
## Timestamp:           time
## Lifecycle transition:        registration_type
##
## # A tibble: 114 × 7
##    handling   patient employee handling_id registration_type time
##    <fct>      <chr>   <fct>    <chr>       <fct>             <dttm>
##  1 Registrat… 81      r1       81          start             2017-03-30 13:32:50
##  2 Registrat… 118     r1       118         start             2017-04-30 17:49:37
##  3 Registrat… 140     r1       140         start             2017-05-17 08:37:35
##  4 Registrat… 196     r1       196         start             2017-07-11 03:39:26
##  5 Registrat… 245     r1       245         start             2017-08-27 17:24:15
##  6 Registrat… 254     r1       254         start             2017-09-08 06:31:49
##  7 Registrat… 275     r1       275         start             2017-09-24 22:29:19
##  8 Registrat… 366     r1       366         start             2017-12-09 23:10:13
##  9 Registrat… 411     r1       411         start             2018-01-30 08:04:41
## 10 Registrat… 432     r1       432         start             2018-02-18 06:58:33
## # ℹ 104 more rows
## # ℹ 1 more variable: .order <int>
Note that this function can also be used with a sample size bigger than the number of cases in the event log, if you allow for the replacements of drawn cases.
A more extensive list of subsetting methods is provided by edeaR. Look here for more information.
Read more:
Copyright © 2025 bupaR - Hasselt University