bupaR Docs | Trace Explorer
![]()
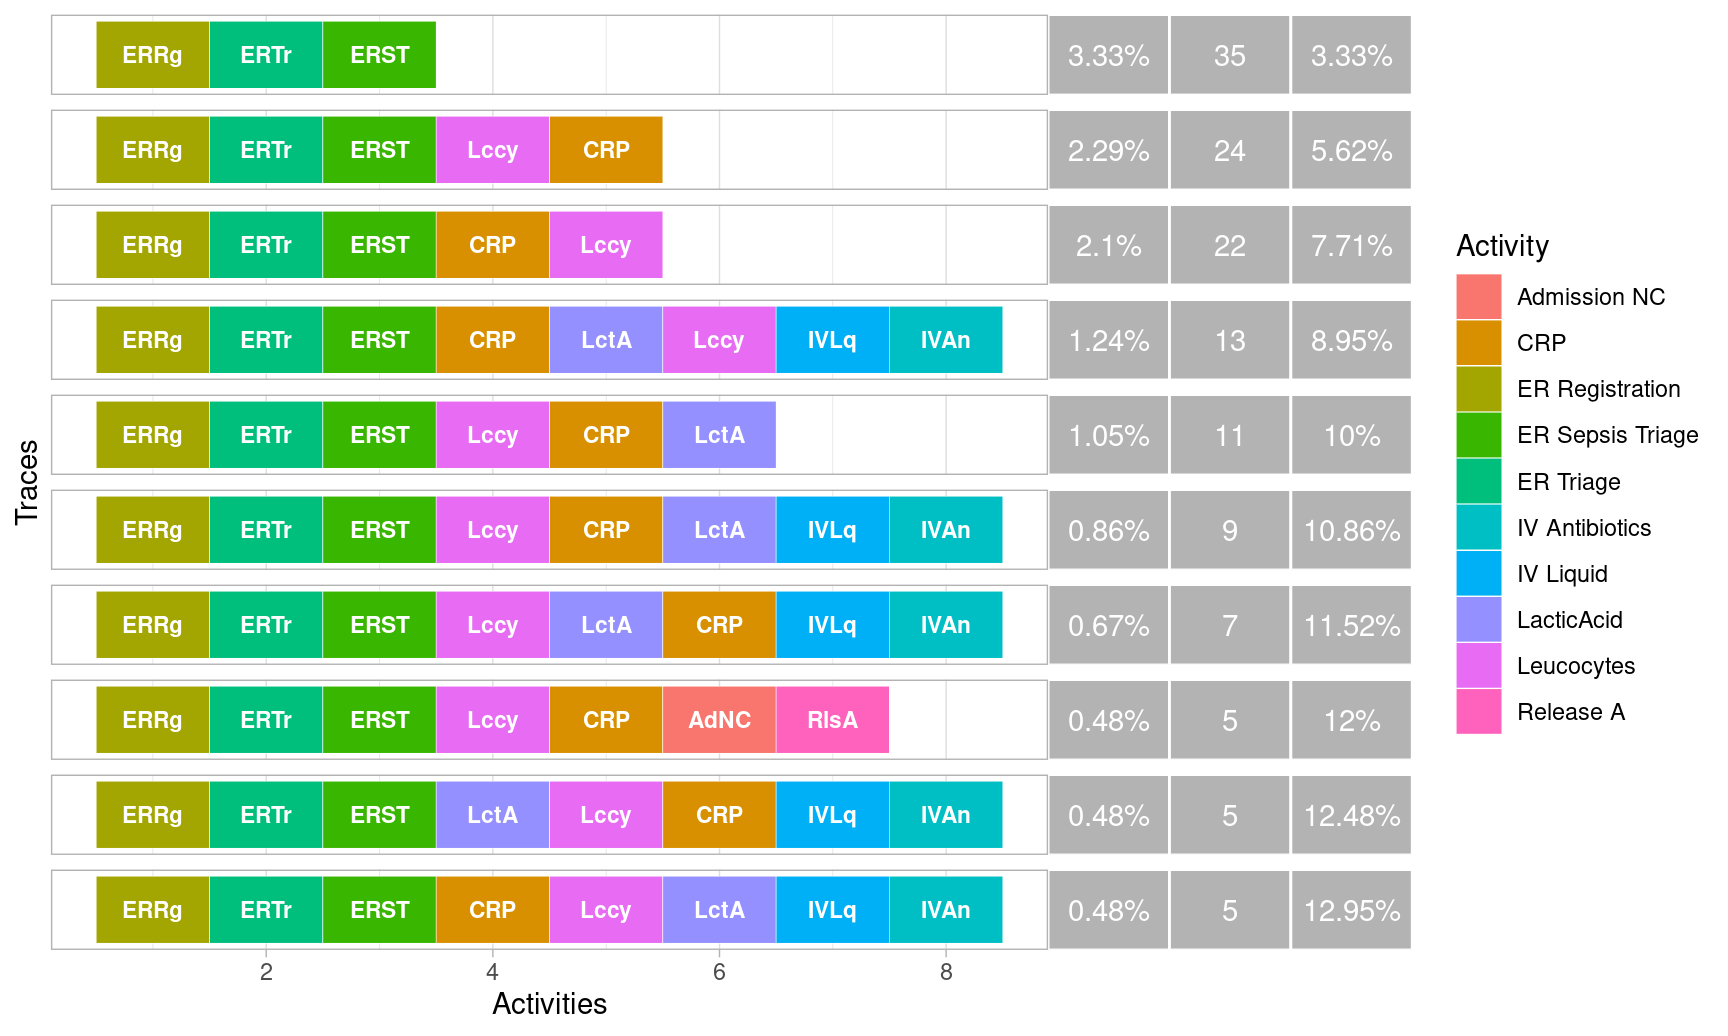
Trace exlorer
Different activity sequences in the log can be visualized with
trace_explorer(). It can be used to explore frequent as
well as infrequent traces.
Set coverage
The coverage argument specifies how much of the log you
want to explore. By default it is set at 0.2, meaning that it will show
the most frequent traces covering 20% of the event log.
## Warning: No `coverage` or `n_traces` set.
## ! Defaulting to `coverage` = 0.2 for `type` = "frequent" traces.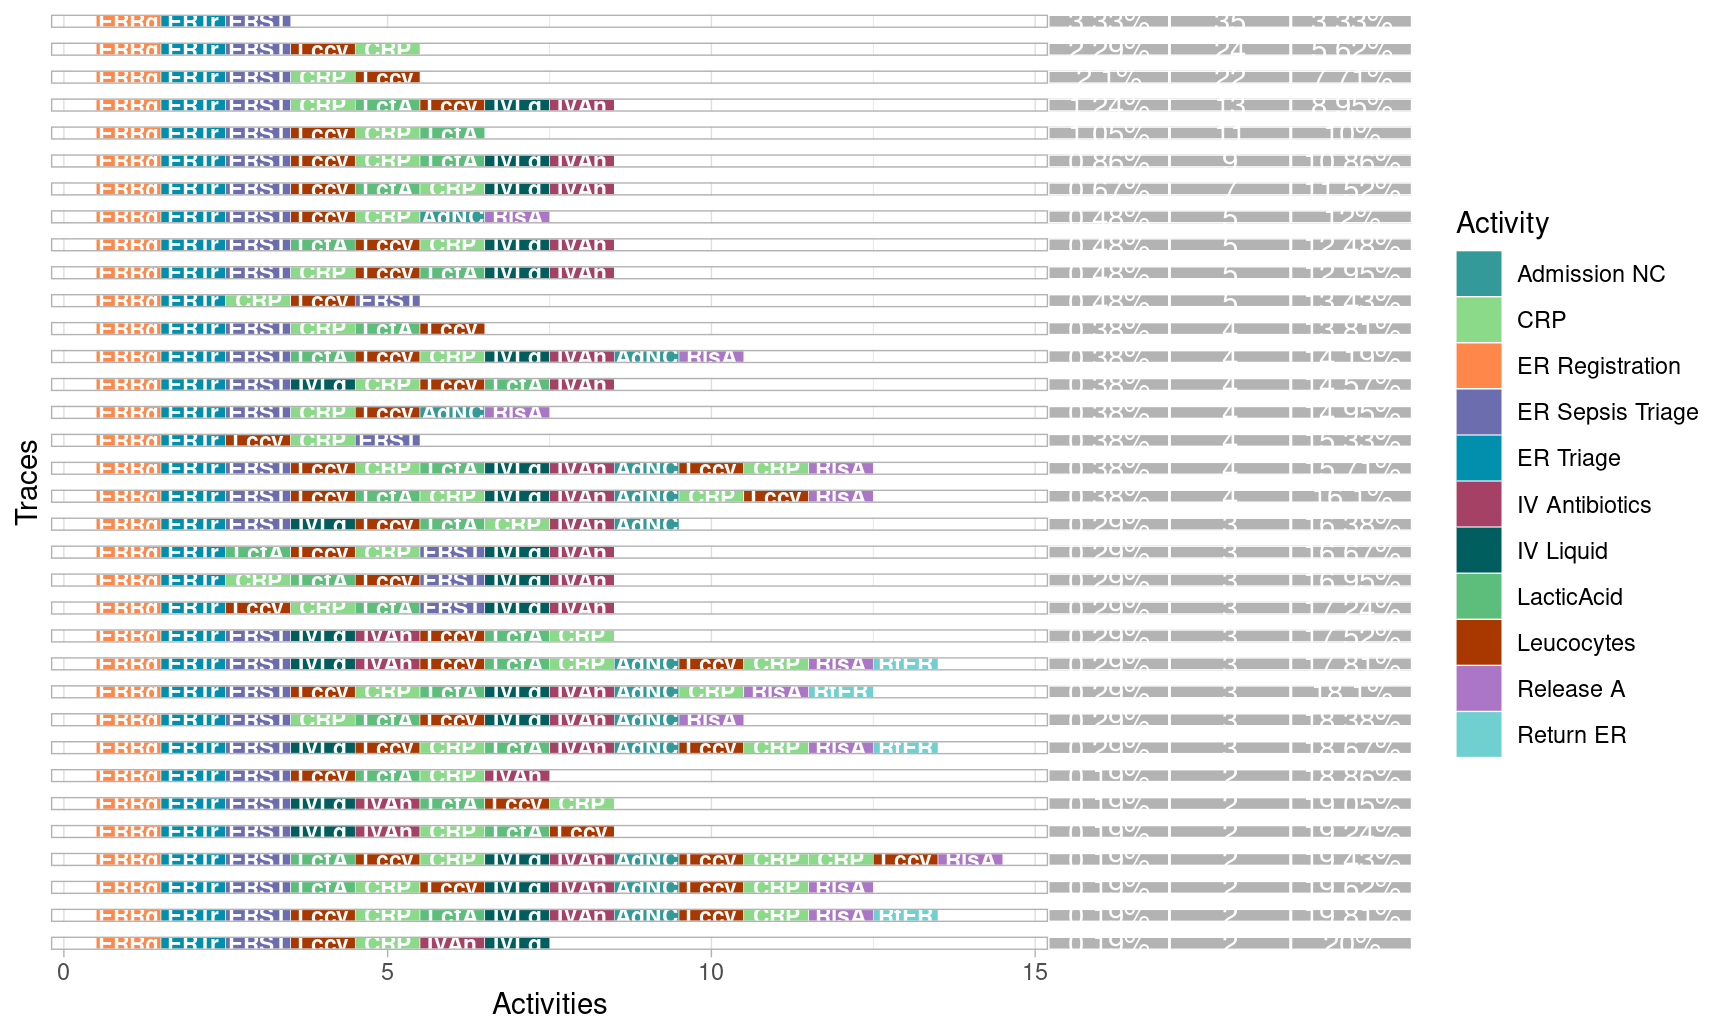
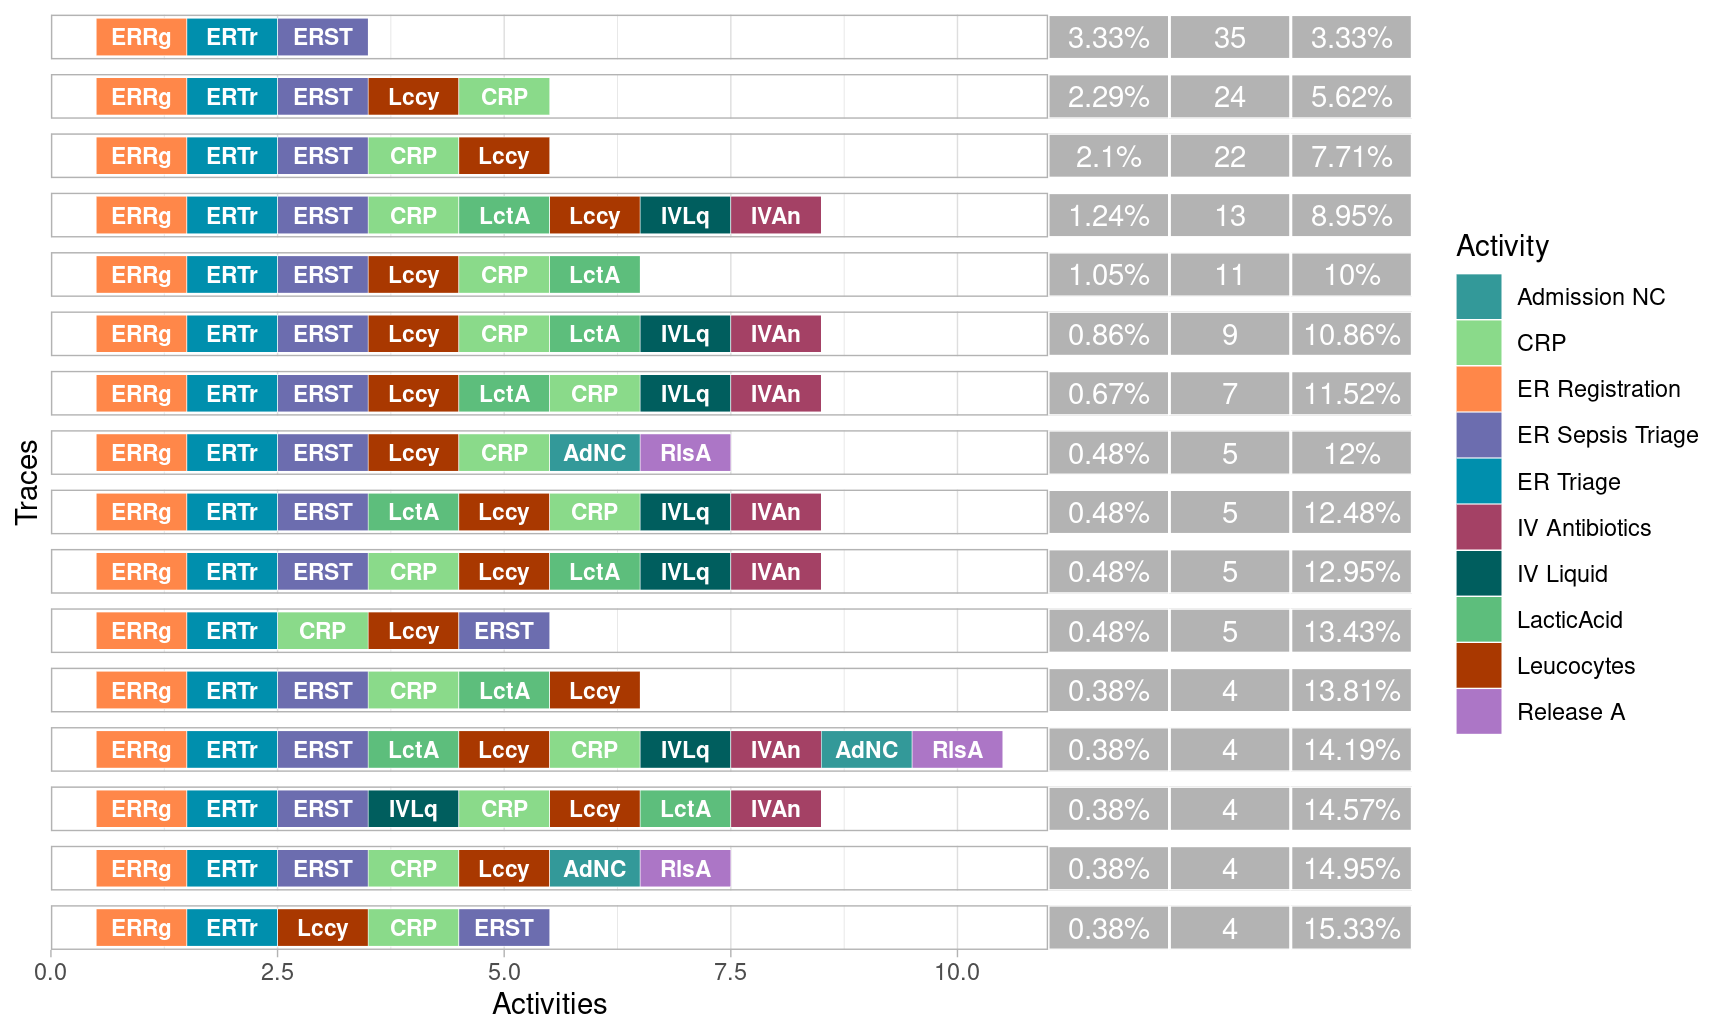
You can also set the coverage by directly specifying the number of traces to show.
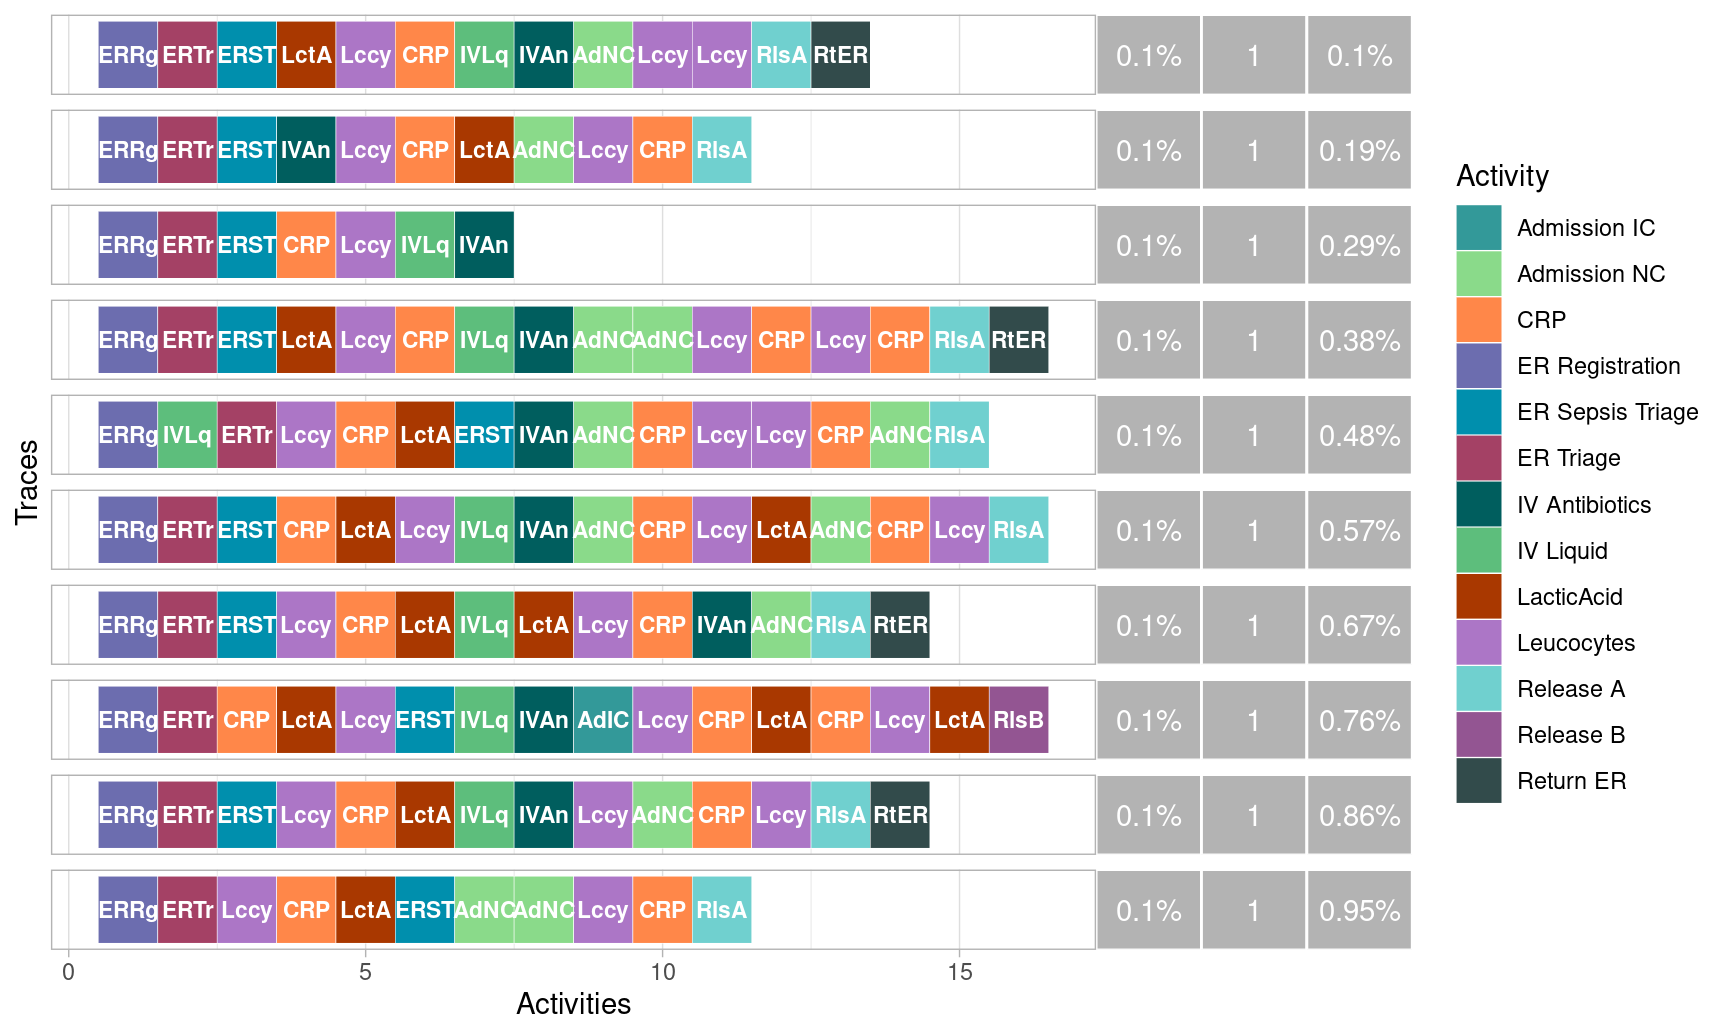
Instead of giving priority to frequent traces, you can show infrequent traces.
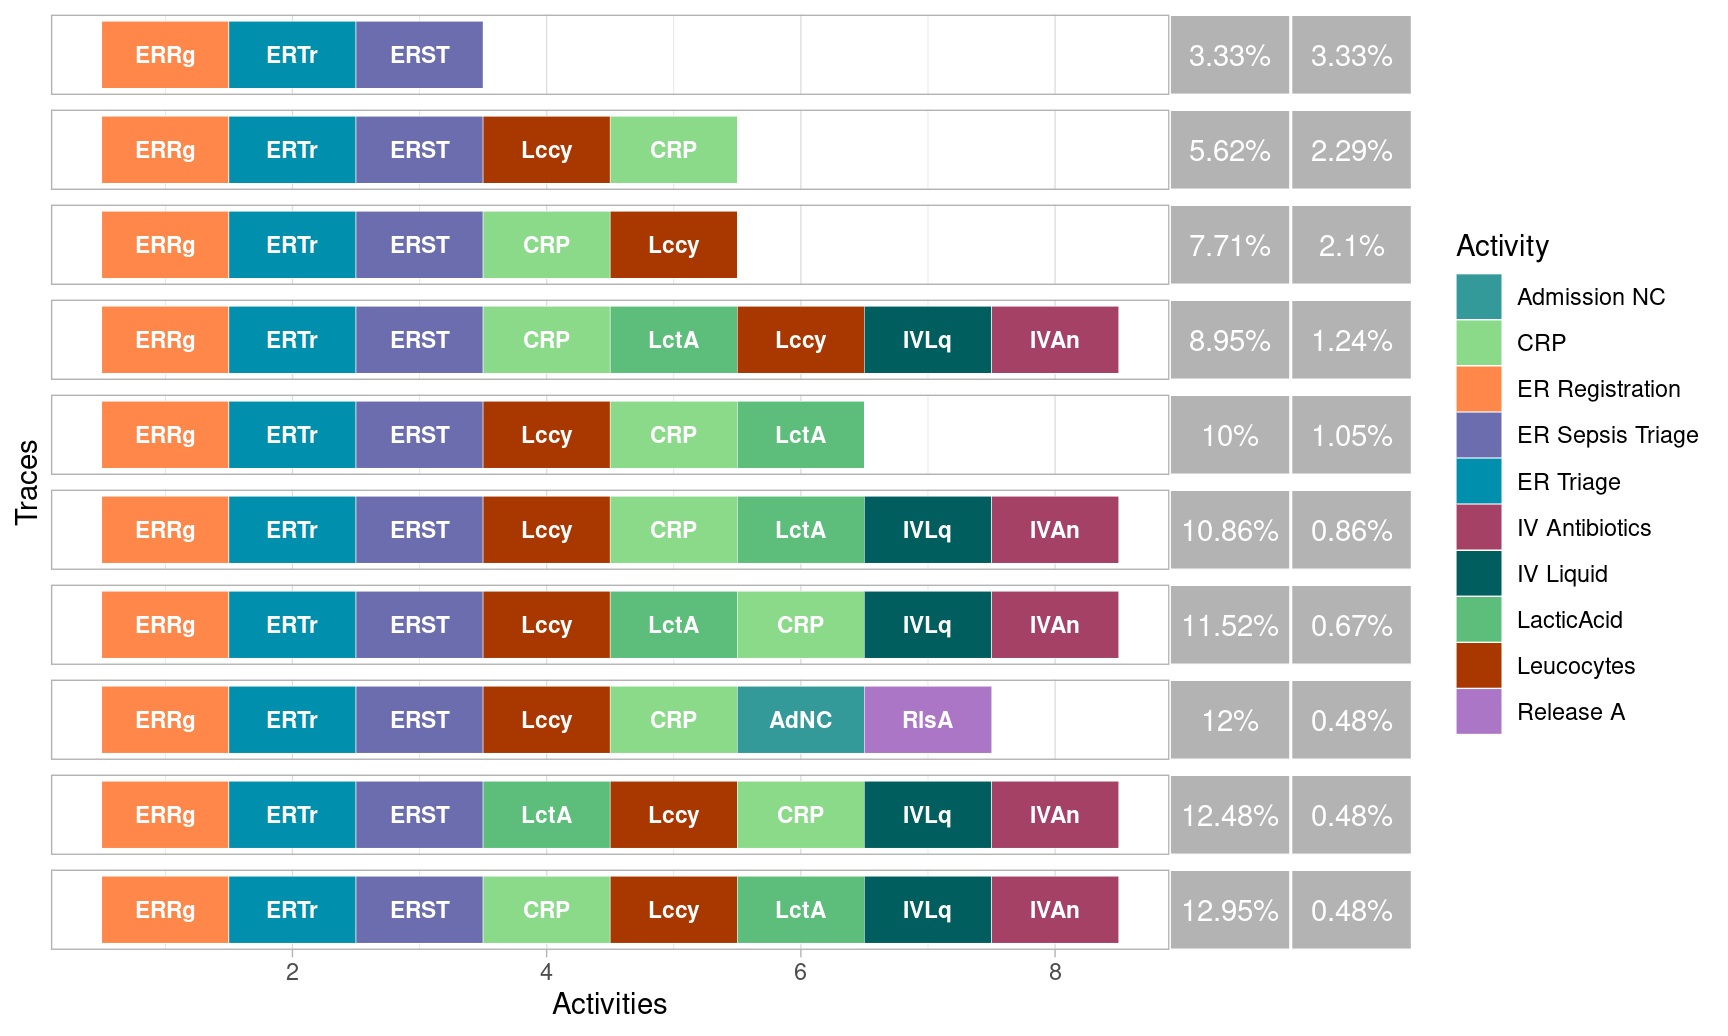
Set metrics
The trace_explorer() shows three metrics by default:
- relative coverage of the trace
- absolute coverage of the trace
- cumulative coverage of this and previous traces
You can set which metric to include using
coverage_labels, as well as change the order.
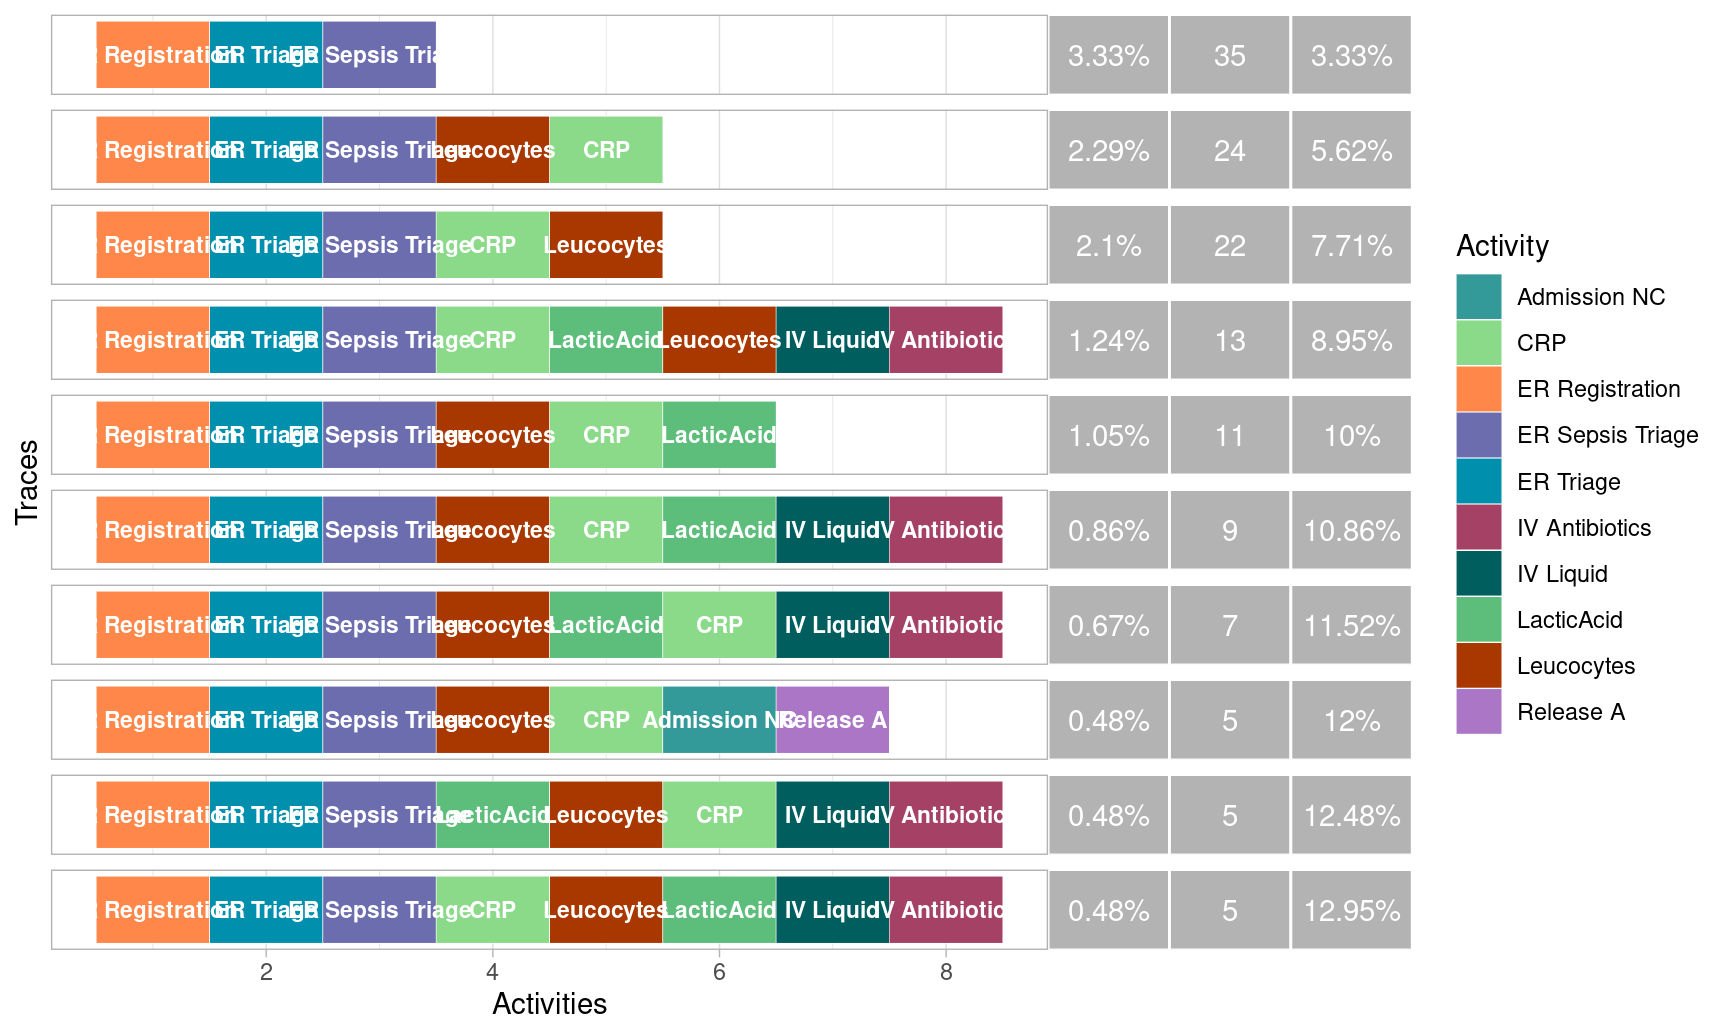
Set labels
The labels shown on the traces can be configured with the arguments
label_size, show_labels and
abbreviate.
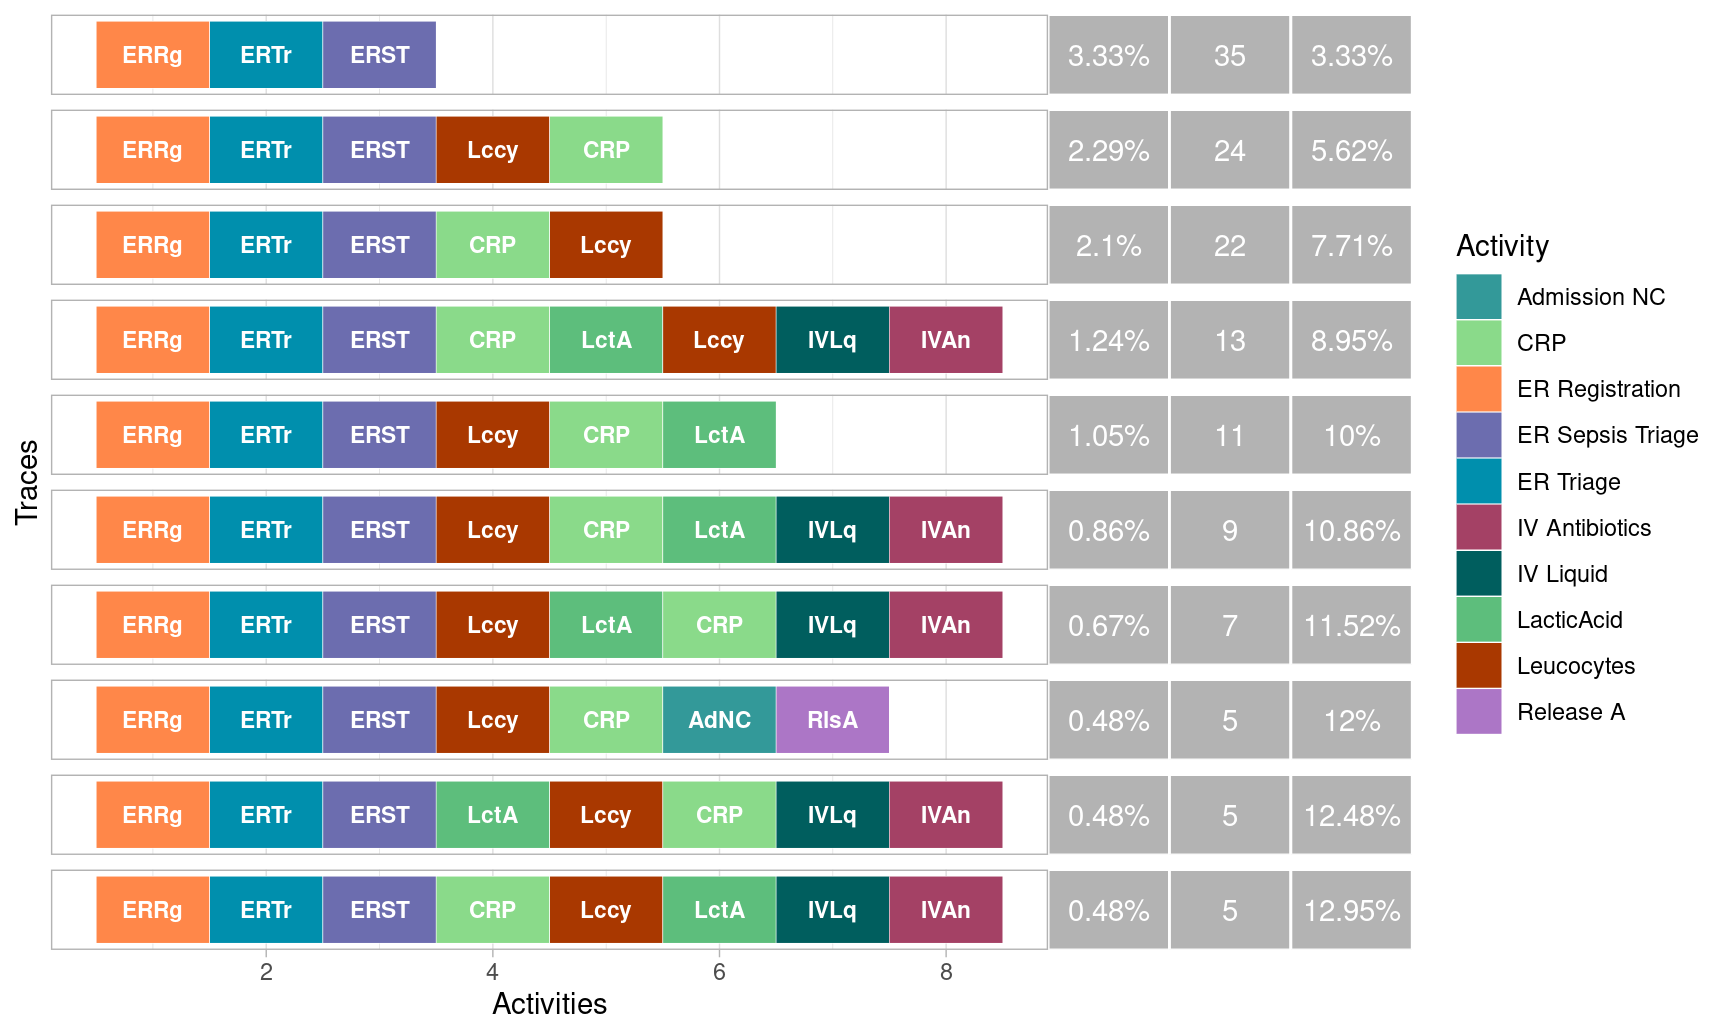
Increasing the label size.

Removing the labels.

Disabling the abbreviation of labels.
Copyright © 2025 bupaR - Hasselt University