Performance Analysis
![]()
Performance analysis
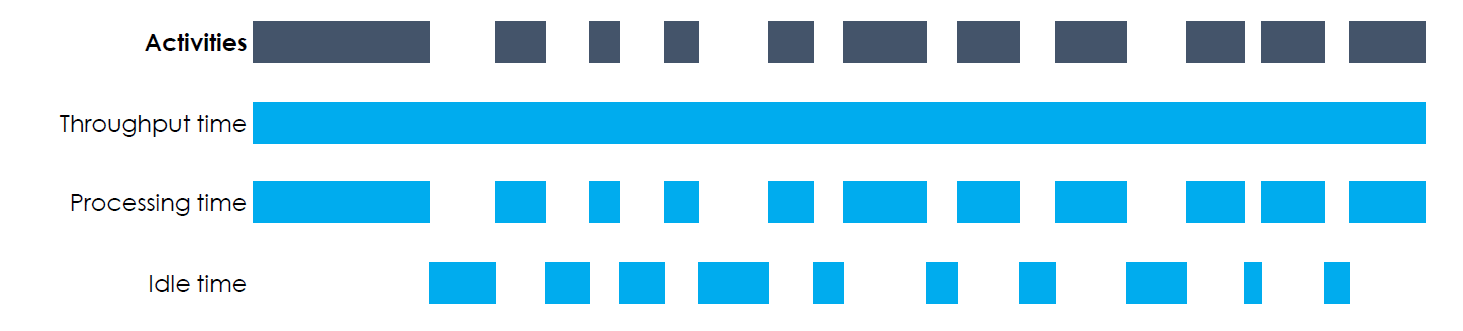
Three different time metrics can be computed:
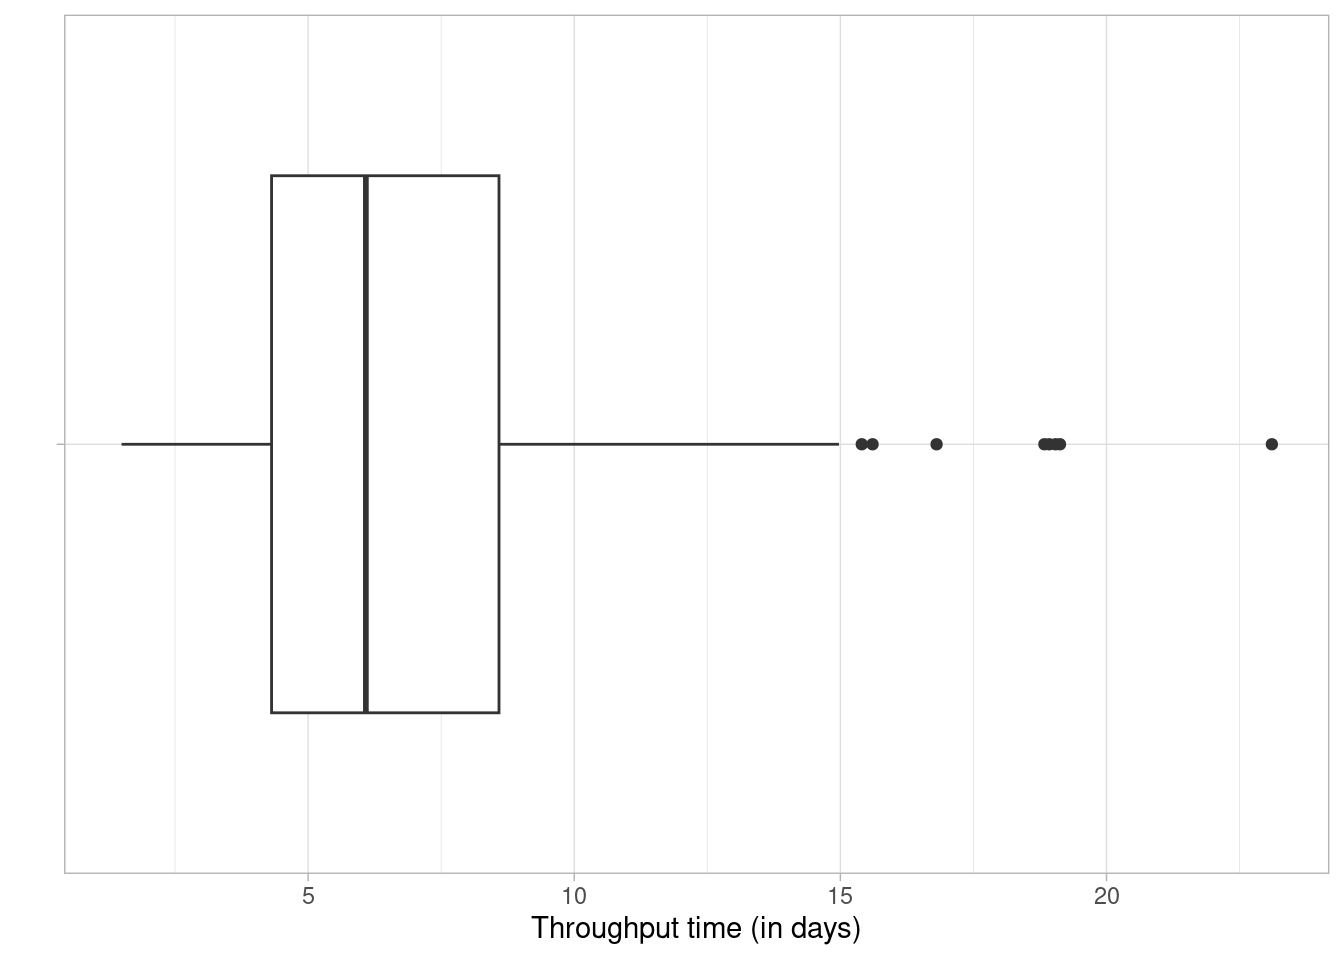
- throughput time: the time between the very first event of the case and the very last
- processing time: the sum of the duration of all activity instances
- idle time: the time when no activity instance is active
The duration of an activity instance is the time between the first and the last event related to that activity instance. In case several activity instances within a case overlap, processing time for that overlap will be counted twice. The figure below shows a schematic overview of different time metrics.
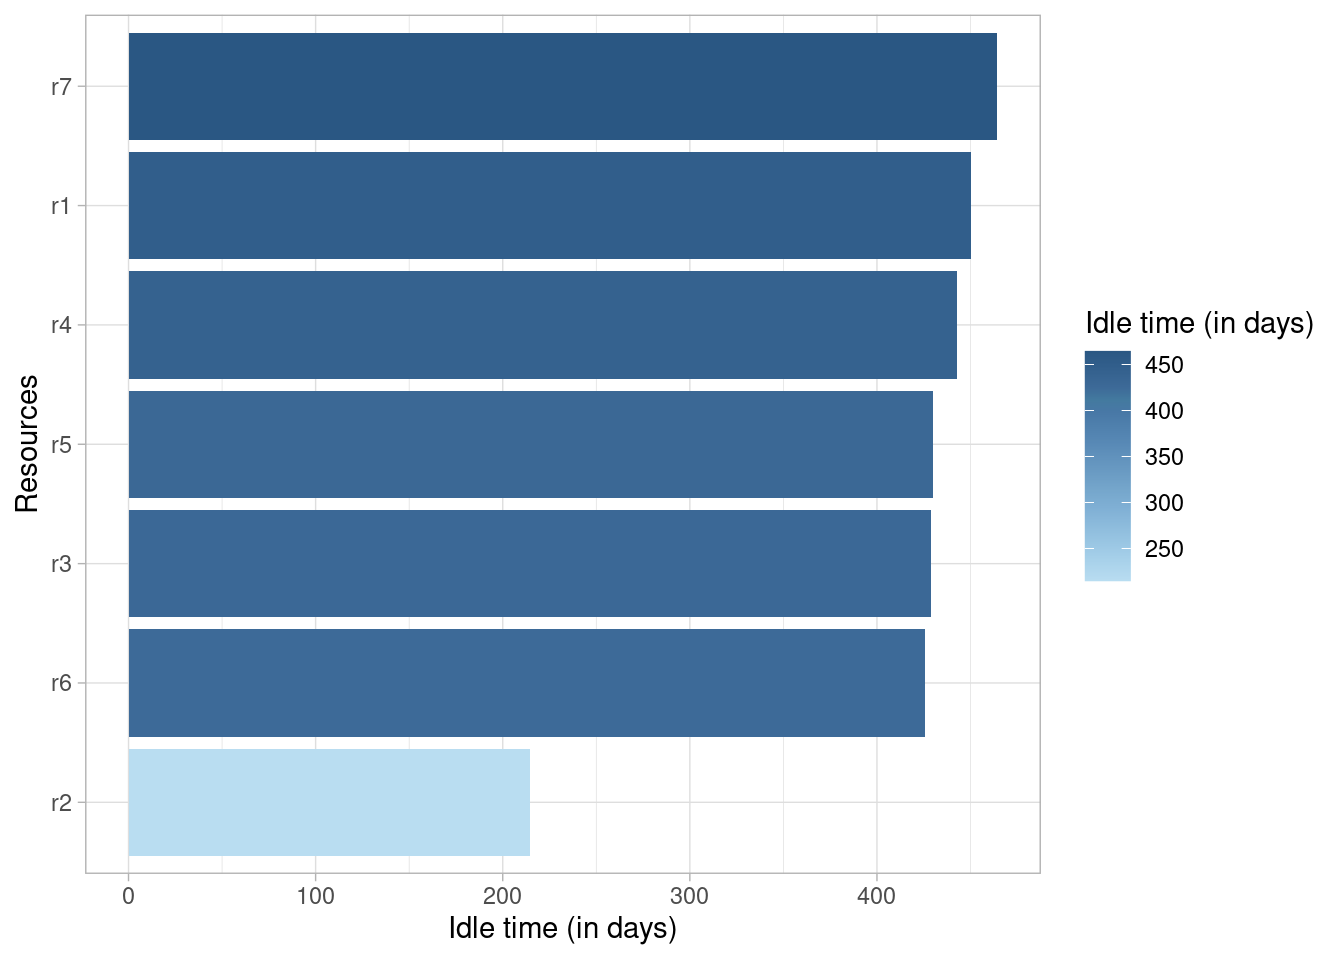
Idle Time
The idle time is the time that there is no activity in a case or for a resource. It can only be calculated when there are both start and end timestamps available for activity instances. It can be computed at the levels trace, resource, case and log, and using different time units.
## # A tibble: 7 × 2
##   employee idle_time
##   <fct>    <drtn>
## 1 r7       464.4199 days
## 2 r1       450.2124 days
## 3 r4       442.6260 days
## 4 r5       430.1764 days
## 5 r3       429.1064 days
## 6 r6       425.5362 days
## 7 r2       214.7436 days
The output of all metrics in edeaR can be visualized by supplying it to the plot function.
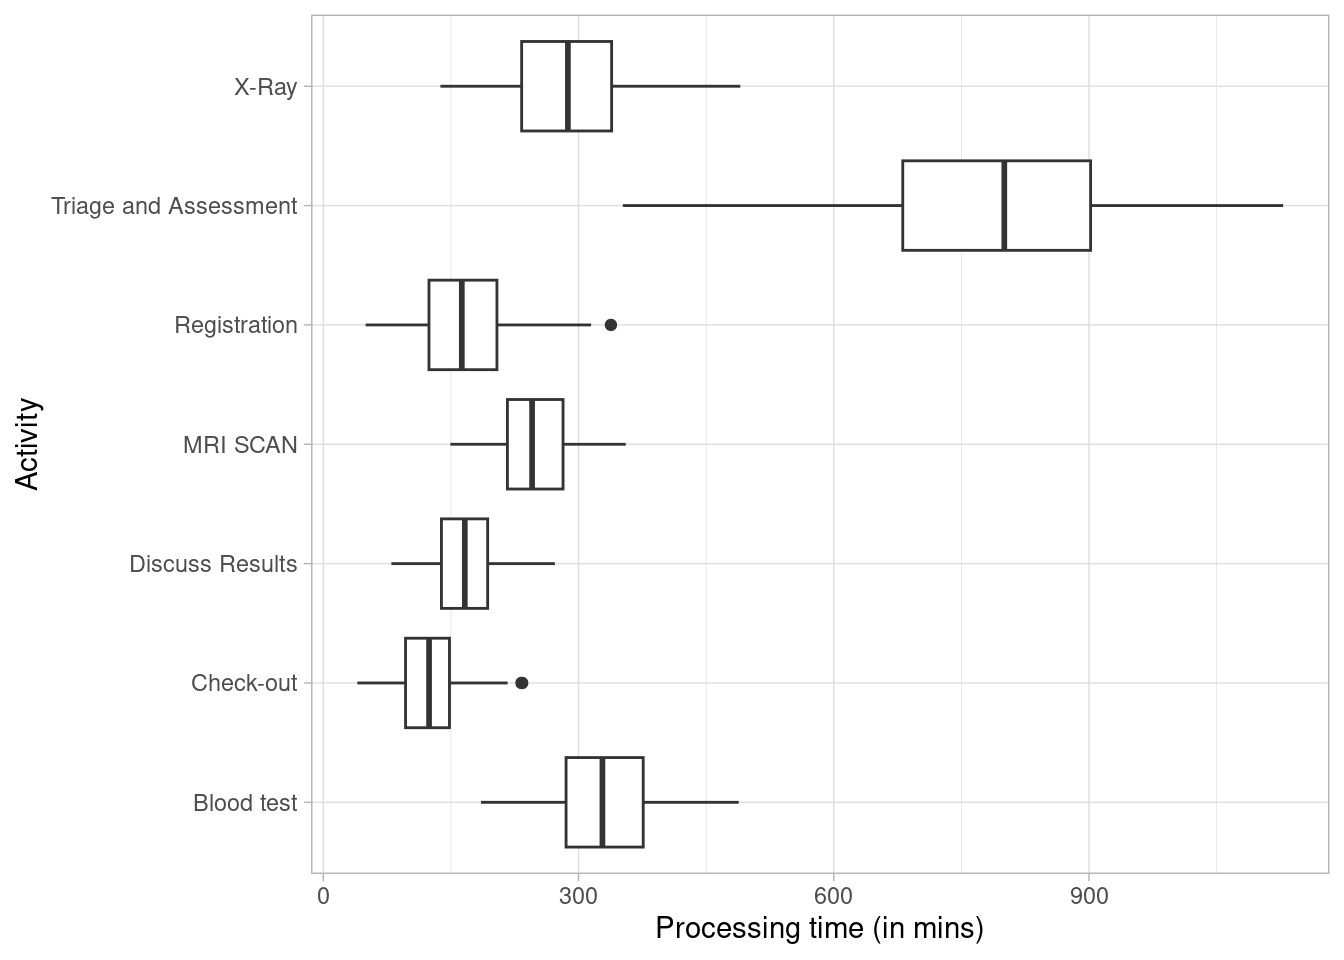
Processing Time
The processing time can be computed at the levels log, trace, case, activity and resource-activity. It can only be calculated when there are both start and end timestamps available for activity instances.
Copyright © 2025 bupaR - Hasselt University